Talking Points:
-Slow Stochastic provides clear signals in a forex strategy
-Take only those signals from overbought or oversold levels
-Filter forex signals so you are taking only those in the direction of the trend
Stochastic is a simple momentum oscillator developed by George C. Lane in the late 1950’s. Being a momentum oscillator, Stochastic can help determine when a currency pair is overbought or oversold. Since the oscillator is over 50 years old, it has stood the test of time, which is a large reason why many traders use it to this day.
Though there are multiple variations of Stochastic, today we’ll focus solely on Slow Stochastic.
Slow stochastic is found at the bottom of your chart and is made up of two moving averages. These moving averages are bound between 0 and 100. The blue line is the %K line and the red line is the %D line. Since %D is a moving average of %K, the red line will also lag or trail the blue line.
Traders are constantly looking for ways to catch new trends that are developing. Therefore, momentum oscillators can provide clues when the market’s momentum is slowing down, which often precedes a shift in trend. As a result, a trader using stochastic can see these shifts in trend on their chart.
Learn Forex: Slow Stochastic Entry Signals
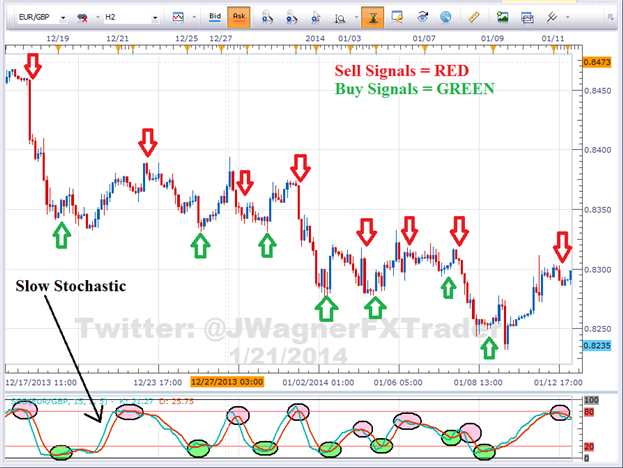
(Created using FXCM’s Marketscope 2.0 charts)
Momentum shifts directions when these two Stochastic lines cross. Therefore, a trader takes a signal in the direction of the cross when the blue line crosses the red line.
As you can see from the picture above, the short term trends were detected by Stochastic. However, traders are always looking for ways to improve signals so they can be strengthened. There are two ways we can filter these trades to improve the strength of signal.
1 - Look for Crossovers at Extreme Levels
Naturally, a trader won’t want to take every signal that appears. Some signals are stronger than others. The first filter we can apply to the oscillator is taking cross overs that occur at extreme levels.
Learn Forex: Filtering Stochastic Entry Signals
(Created using FXCM’s Marketscope 2.0 charts)
Since the oscillator is bound between 0 and 100, overbought is considered above the 80 level. On the other hand, oversold is considered below the 20 level. Therefore, cross downs that occur above 80 would indicate a potential shifting trend lower from overbought levels.
Likewise, a cross up that occurs below 20 would indicate a potential shifting trend higher from oversold levels.
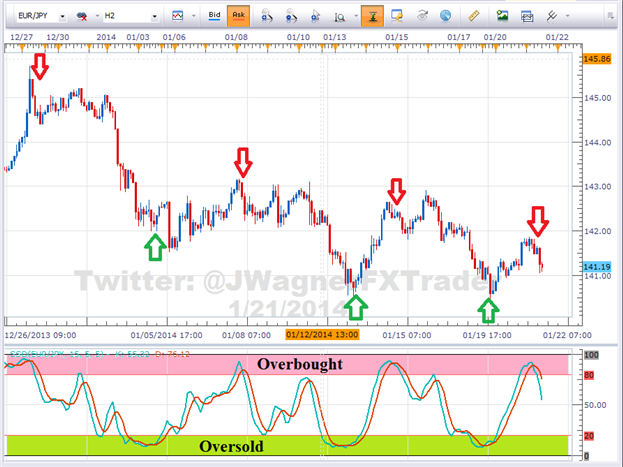
2 - Filter Trades on Higher Time Frame in Trend’s Direction
The second filter we can look to add is a trend filter. If we find a very strong uptrend, the Stochastic oscillator is likely to remain in overbought levels for an extended period of time giving many false sell signals.
We would not want to sell a strong uptrend since more pips are available in the direction of the trend. (see “2 Benefits of Trend Trading”)
Therefore, if we find a strong uptrend, we need to look for a dip or correction to time a buy entry. That means waiting for an intraday chart to correct and show oversold readings.
At that point, if Stochastic crosses up from oversold levels, then the selling pressure and momentum is likely alleviated. This provides us a signal to buy which is in alignment with the larger trend.
In the EURJPY chart above, prices were well above the 200 Day Simple Moving Average (the moving average wasn’t shown because it was well below the current prices). Therefore, if we filtered trades according to the trend on a daily chart, then only the long signals (green arrows) would have been taken.
Therefore, traders use Stochastic to time entries for trades in the direction of the larger trend.


